 |
| VIX Volatility Index as at 22nd May 2011 |
 |
| DOW JONES as at 22nd May 2011 |
 Intra day volatility is going through the roof on some days while on others it is quite flat. Over the past week the DOW dropped 80 points one day due to rumours around further Greek sovereign debt worries, and then jumped up 60 odd points the day after on the basis that the Bond market was not that worried. One and two standard deviation moves happening back to back are becoming an all too familiar sight on the markets these days.
Market Makers have essentially been reflecting this market indecision by concentrating more on the IV of the front month rather than the back month and thus strategies such as Calendars are finding that the gain through rising IV in the back month is just not enough to compensate you for the IV crush that happens to your short front month legs in the Calendar resulting in the trade losing money. This has been a familiar pattern over the past six months as the IV keeps dropping but intra day spikes keep the Market Makers on their toes.
So if we believe that the market is on it's highs and a material reversal is just around the corner and we want to do Calendars, how much pain can we take from IV crush once we are in a trade ?
One way that we can gauge the pain and establish a rough point for when we would have to adjust our trade is to use the following formula:
IV of long option - (Calendar Skew * 150%)
 |
| SPX ATM Calendar Skew - 22nd May 2011 |
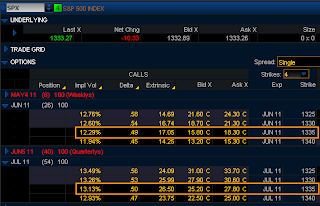
June IV : 12.29%So adjusting the ATM IV of the long back months option by 150% of the skew we get :
July IV : 13.13%
Absolute Skew is : 0.84%
13.13% - (0.84% x 150%) = 11.87%
The interpretation of this 11.87% is that the IV of the trade can drop from 13.13% down to 11.87% before this trade will begin to lose money. That is and IV crush of 1.26% or a negative move of around 9.6% in IV before we begin to feel the pain in this trade. Another way to look at the 11.87% is that if the IV drops and the 0.84% skew disappears, then the price of the Calendar should still be around the same price we entered the trade for. This would enable us to exit the trade near break-even.
Cheers


No comments:
Post a Comment