Sunday, August 28, 2011

"help someone see a better future ...."

Way back on 15th January 2010, I raised the question around the severity of unemployment and the collateral damage it has on individuals, families and the economy. This week, Ben Bernake speaking at the Feds annual retreat at Jackson Hole Wyoming, on the economy made the following statement :
We cannot afford to stand by idly while millions of Americans remain unemployed or underemployed for years and years, Federal Reserve Chairman Ben Bernanke said Friday. It’s up to Congress and the Obama administration to do something to speed up the sluggish recovery ....

Ben Bernake - August 26th 2011

 For an economist who is touted as one of the foremost exponents of the Great Depression and the economic impacts it savaged in its wake, I cannot help wondering how both Bernake and the Fed missed the following signals :
  • Both the quantitative easings really seemed to miss the economic stimulus target,
  • Immediately after the GFC crash initially and recently, politicians clearly exhibited a passion for arguing their own case in the senate rather than looking at the bigger global economic picture - this puerile idiocy wiped around US$7 trillion off world markets when the funding supply bill stalled in the senate last month.
  • Right back in the 1940's when Keynes wrote his ground breaking work on Money, Employment and Interest rates, it was obvious then to every undergraduate that employment was the core key to economic stimulus. The dollars earnt from a job would be split between stimulating domestic consumption, impacting the velocity of money (MV=PT), and personal savings, where banks, if suitably rewarded would lend back into the economy, driving further stimulus.
  •  And on the regulatory & governance side of things, how could they have missed the poorly conceived impacts of Basel II on financial institutions - simply stated Basel guided banks to get better data so they could build smarter models so that they could cut their capital holdings. Enter the GFC, stage left, and retail savings dried up, wholesale markets crashed and burned so global funding markets were not prepared to lend, liquidity went from reality to a definition in a dictionary. The result was hundreds of financial institutions failed and we now have Basel III - and do you know what the result of Basel III is ? Tougher controls around liquidity holdings, removal of convoluted hybrid capital instruments from tiered capital calculations and tougher stress testing (which most banks seem to still be failing). So how does an organisation like the Fed miss these really big systemic shifts - do they need it written on the back of their cereal packets so they get a hint each morning ?

  • Another great gaff : Mark to Market, Value at Risk and the accountants need to tell the world that there has been a financial change. Portfolios are marked to market each day and the accounting standards enforce that a CFO must inform the market of any material changes under the continuous disclosure rules. So when there has been a market glitch and CNBC run the story ragged and the markets sell down banks, continuous disclosure kicks in and although in many cases there was no material changes in these financial institutions structurally, the portfolio values had changed overnight due to market prices materially moving as a result of a news item or similar issue. The following day the markets open lower and the CFO reports the change, the markets reacted and the portfolios go down again & still nothing material is happening in the institution. This cycle keeps repeating until the market comes to its senses. How did the regulators deal with this ? They changed the rules and allowed institutions to make a call on when they should inform the markets and gave them discretion on how big a move would be seen as material and in conjunction with their auditors they can decide if the continuous disclosure rules will apply. Unbelievable, wish I could do this with my tax return.
  • The theme that is developing here is that politicians and regulators have taken their eye of the main ball : EMPLOYMENT, and keep re-regulating and focusing on the economic symptoms which continue to occur at a more frequent and alarming rate and we continue to move ever so close to recession and or deflation.
 Hey Ben, even in ancient times they new the value of   "Teach a man to fish ......"

Unemployed & in debt ...
Cheers

    Sunday, June 12, 2011

    "Poetry as evidence of life ...."

    Poetry is just the evidence of life,
    If your life is burning well,
    then poetry is just the ash.
    Leonard Cohen, I'm Your Man 2010


    Cheers

    Sunday, May 22, 2011

    "Not waving, drowning in IV crush ..."

    Over the past year the VIX has been steadily dropping from a high around 47.50% to the current level of around 15.5%. Some would say that this is a significant drop indicating that the volatility in the market has gone away and that Calendars are probably an excellent option strategy to employ. The rationale behind this is because if IV is mean reverting, then there is an expectation that IV will begin to rise significantly as the market hits all time post CFC highs and reverses.

    VIX Volatility Index as at 22nd May 2011
    A glance at any of the main indexes shows that they are all at their highs and comments in the markets from fund managers and traders alike suggest that a major retracement is imminent - interestingly the commentators have been saying the pull back is imminent for months now and yet the market just keeps rising and the VIX just keeps dropping.

    DOW JONES as at 22nd May 2011
    So if IV is so low, how have Calendars been going over the last few months. In a word, horrible. But why is this happening. The short answer is that the VIX is really not telling us the full stroy on IV.

    Intra day volatility is going through the roof on some days while on others it is quite flat. Over the past week the DOW dropped 80 points one day due to rumours around further Greek sovereign debt worries, and then jumped up 60 odd points the day after on the basis that the Bond market was not that worried. One and two standard deviation moves happening back to back are becoming an all too familiar sight on the markets these days.

    Market Makers have essentially been reflecting this market indecision by concentrating more on the IV of the front month rather than the back month and thus strategies such as Calendars are finding that the gain through rising IV in the back month is just not enough to compensate you for the IV crush that happens to your short front month legs in the Calendar resulting in the trade losing money. This has been a familiar pattern over the past six months as the IV keeps dropping but intra day spikes keep the Market Makers on their toes.

    So if we believe that the market is on it's highs and a material reversal is just around the corner and we want to do Calendars, how much pain can we take from IV crush once we are in a trade ?

    One way that we can gauge the pain and establish a rough point for when we would have to adjust our trade is to use the following formula:
    IV of long option - (Calendar Skew * 150%)

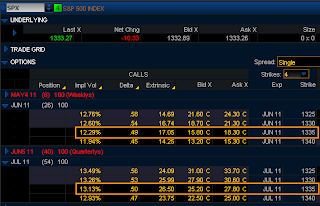
    SPX ATM Calendar Skew - 22nd May 2011
     Plugging in the numbers from the option chain for an ATM $1335 Call Calendar we get :
    June IV : 12.29%
    July IV :  13.13%
    Absolute Skew is : 0.84%
    So adjusting the ATM IV of the long back months option by 150% of the skew we get :

    13.13% - (0.84% x 150%) = 11.87%

    The interpretation of this 11.87% is that the IV of the trade can drop from 13.13% down to 11.87% before this trade will begin to lose money. That is and IV crush of 1.26% or a negative move of around 9.6% in IV before we begin to feel the pain in this trade. Another way to look at the 11.87% is that if the IV drops and the 0.84% skew disappears, then the price of the Calendar should still be around the same price we entered the trade for. This would enable us to exit the trade near break-even.


    Cheers

    Thursday, May 12, 2011

    "NAB - rewarding us with high risk ..."

    Back in mid March, NAB finally snapped out of the channelling wave 4 that it had been wallowing in for close on eight months and since then has been in a significant wave 3 rising to a recent high of $28.18.

    NAB Daily - 12th May 2011
    In the chart above we can see that the Wave 3 looks to have completed right on the price predicted by the MOB - $28. So where to next ?

    Elliott Wave theory would suggest that there will now be a pull back to around 38% and then the upward trend would continue with a new Wave 5. Well that's the theory anyway. The immediate concern is that if we look at each of the points 1, 2 & 3 marked on the chart, each of them in turn looked as if it may have been the peak of the wave 3 and when the retracement began the price retraced to the 38% point and then returned to the upward trend. Even today the DOW dropped 139 points and the ASX has opened down with NAB droppi9mng and as at 12.08pm, NAB had touched the 38% retracement. If the previous examples are any guide for us, we should probably wait to initiate any PUTs to protect us on the downside until it is clear whether NAB will break the 38% point and move onto a more solid 50-68% retracement level.

    Whilst reaching the 50% retracement level might be a safer point to enter the trade, the price is virtually breeching the wave 4 band (green & red) and at this point there would be an expectation for NAB to halt it's decline and reverse back into the Wave 5 rising trend.

    So the conclusion here is that NAB cannot meet a reasonable risk to reward ratio to incent us to take a trade at this point. We need to wait until the 50% retracement is breeched or the Wave 5 begins.


    Cheers

    Saturday, May 7, 2011

    "the increadible lightness of knowledge ..."

    We are but a few kindred spirits separated only by the years ...


    Cheers

    Monday, April 25, 2011

    "the non reality of Magritte & the GFC ...."

    " the treachery of risk graphs"

    Magritte - The Treachery of Images (La trahison des images, 1928–29)

    AAPL Iron Butterfly 340/250/250/260 @ 21st April 2011


    Cheers

    Saturday, April 2, 2011

    "NAB - trespassers presecuted with vigour ...."

    Two days ago on the 29th March we observed that NAB appeared to be at a crossroads with the current Wave count in a Wave 4 and looking to begin the downward retracement into the next Wave 5 low. But there were some danger sign.

    NAB Daily - 29th March 2011
    In the chart above we were watching to see if price would turn on the first short term ellipse, (yellow),  or go on higher to the next longer term ellipse in blue. As we saw in the previous post, price was strong and had exceeded the 138% Fibonacci retracement which was signalling that a Wave 4 was potentially in trouble.

    Our concern in the above chart is that if the price movement is too strong and travels up into the space of Wave 1 then we are likely to get a wave count. By April 1st this is what has happened.

    NAB Daily - 1st April 2011 - New Wave 3
    As price traded above the Wave 1 low, the Elliott Wave recounted and went from the Wave 4 high into a new Wave 3. Taking a plot from the previous Wave 5 high show the MOB target for this Wave 3 high around $28 by mid July. The question is how practical or possible is this as a target, and secondly are we now in a sustainable Wave 3 or will the pattern revert to the earlier Wave 4?

    A conservative short term target would be to buy some May $26.50 Calls if you consider that the momentum is to continue in the near term. If you look at the wider global markets, the DOW in particular has just broken out of it's regression channel indicating possible weakness. In addition, overall volumes have been thin and unconvincing as the US markets rose over the past two weeks.

    The lack of strong volumes over the past two weeks, together with the price bias for PUTs at the moment, one might be forgiven if they stayed out of this rally on the off chance that it is close to peaking and any trade would not yield sufficient reward to risk ratio to compensate for the markets skittishness.


    Cheers

    Sunday, March 27, 2011

    "NAB - in the midst of an identity crisis ..."

    Just on one month ago, (18th February), we looked at NAB which appeared to be topping out on a Wave 5 high. At this time we speculated that although the immediate chart for NAB showed an upward bias, the longer term weekly and monthly charts were still pointing down.

    Since the 18th February NAB has indeed dropped significantly into a material retracement and as at the 20th March, it was finding support around $24.50.

    NAB Daily chart  - 20th March 2011.
    In the past, NAB seems to have exhibited a penchant for hitting a support, and if it stumbles around this point for 2, 3 or 4 days, then this seems to become a new bottom and the price turns from here.

    In the chart above, we have this exact scenario around the $24 mark and the anticipation is that NAB would begin to rise over the next week. In fact this is what happened.

    NAB Daily chart - 25th March 2011.
    In the chart above,  NAB has maintained the support around the $24 level [A] which was also our previous Wave 3 target low [B], and begun a very convincing retracement for the next phase of the Elliott pattern which is a Wave 4 with a retracement target between the 50% & 62% Fibonacci target points [C].  This range is reinforced by the ellipse tool also targeting a level around $25 to $25.30 [E]

    The objective will be to watch for the beginning of a new Wave 5 low. This will be indicated by the price breaking to the downside out of the regression channel [F] and then cutting below the 6,4 Displaced Moving Average. This should give a high probability entry point. Upon entering further PUTs to protect the portfolio's downside, a stop-loss will be placed at the high of the eventual high point around [E], where the stock turned down.

    There are Three potential warning signs in the trade at present that we need to keep in mind. The first is that the price is getting very close to exceeding the red Wave 4 band which would signal that a lower Wave 5 is a remote possibility and that we may get either a Wave recount and this Wave 4 could turn into a Wave 3 and continue much higher or if the price retraces, the proposed Wave 5 low, has a higher probability that it would end in a double bottom around the level of the previous Wave 3 low [B].

    The second warning sign is that the white long term ellipse target at [E], has not yet completed and is showing a higher price range above $25.50, and the third warning sign is that the 5,35 Oscillator, (below), which is below the price chart, is yet to retrace into the range of a 90% to 138% retracement in order to assist in confirming that the Wave 4 is over.

    NAB Daily 5,35 Oscillator Retracement

    In our case above, the Oscillator has quite some way to go before it is in the correct retracement zone. Now the Oscillator could retrace into this zone but in order to do so, price is either going to have to stagnate for a week or so or climb higher to push the Oscillator into the retracement zone. If the price goes higher it will invalidate the Wave 4 channels and potentially breach the maximum 68% Fibonacci level that I like to set as a maximum pull-back for a Wave 4. If the retracement is above the 68% level I think it is a good indication that there is something else going on in this stock and that we need to be alert to change.

    So where to next ? This week is going to be crucial to assisting us determine whether NAB will breach the Wave 4 channels and recount the Elliott Waves from a 4 back to a rising Wave 3 or confirm the 68% Fibonacci level and begin the decline of a new Wave 5 low.

    Seems NAB may have a slight identity crisis over the next week ....


    Cheers

    Sunday, March 13, 2011

    "Oscar would be rotating ..."

    " ... memory, miss Cardew, is the blog we all carry around with us ..."
    Oscar Wilde - "The Importance of Being Earnest"


    Cheers

    Saturday, February 19, 2011

    "NAB - will the new strategy yield a share price of $15 or $35 ... ? "

    NAB - Daily chart 18th Feb 2011

    If we look at the daily chart of NAB as at 18th February 2010, it looks as if NAB has broken out to the repetitive extended Wave 4 channels and is heading up towards a near term target of $27 by Mid March.

    But has it really begun to rise  ?

    If we look at the weekly chart of NAB below, the price at present does look as if it is rising, but the overall trend is down towards a low of $15 to complete the Wave 5 sequence.

    NAB - Weekly chart 18th Feb 2011

    The key question here is how likely is a price drop to $15 for NAB in order to complete a Wave 5 low ? In my opinion it is not very probable.

    Firstly if we look at the monthly chart below, the wave sequence is a long term upward trend. This links well with the indications on the weekly and the daily charts, but is hardly convincing.

    NAB - Monthly chart 18th Feb 2011

    Potentially the weekly chart offers us some clues. In the updated weekly chart below, the immediate price is heading towards a near term high of $34 around the end of July. If the price of NAB does in fact rise, and gets past $30.50, which is the current Wave 4 high, then it is odds on that we would get an Elliott Wave recount and the current wave 3 low would be reset as the start of a Wave 5 high with the current Wave 4 relabelled as a Wave 3.

    NAB - Weekly chart 18th Feb 2011

     In fact in the above chart, the pivot low (P) which is around $20.92 is also at the .612 retracement level with the bulk of the price action sitting right on the .5 Fibonacci retracement level. This point could easily become the Wave 4 low in a new five wave sequence.

    There is one problem with this possibility and that is the Profit Taking Index (PTI) although it is above 37, marginally sitting at 38, the price action which is sitting on the 50% retracement line is well below the Wave 4 bands. This would indicate that if price did in fact rise, it was more likely to make a double top around $30.50 rather than a new high at $35.

    If in fact other external factors, such as China, heavily influenced the financial sector and NAB's price did halt and reverse, then again because the existing Wave 4 had a poor PTI and exceeded the Wave 4 bands, it is likely to only make a double bottom around $20 as an initial target with $15 being the final stop.

    So back to the original question - will NAB's new pricing war strategy be successful and lead to a share price of $25 or will they give in to temptation, join back with the other banks, bump up fees and head towards $15 a share?.

    Cheers

    Saturday, January 29, 2011

    "BHP revisits the scene of the crime ..."

    Back on January 23rd, we looked at the entry trigger for a BHP PUT trade and elected to wait until the price had cut below $44.23 just in case the market decided to run back up and fill the gap on the upside.

    This is in fact what happened and as at 28th January, the price had still not broken below the lower regression channel or the lower support level of $44.23.

    We live in hope of a near term support break through.

    Cheers

    Sunday, January 23, 2011

    "my open pit runeth over ..."

    Finally, after about three days the penny seems to have dropped with the global markets that the floods in Australia will be very damaging to BHP and it various mining interests. Last week I looked to enter a long PUT one strike OTM. The actual trigger was to wait until BHP had broken below the support of $44.62. [A]

    As the market began to consolidate at this point, which was also highlighted by the ellipse target, I decided to wait for a clearer signal. Luckily I stayed out, and the price of BHP went up based on the news of China's economic growth figures. This was short lived, as the market was reminded of the Australian flood damage, and as of Friday the price of BHP had gapped down materially, but not sufficient to pass the previous support level at $44.25 [B]


    The plan now is to enter a $43.50 PUT once the the price had cut below the support at [B] $44.25 just in case the market decides to run back up and fill the recent gap before returning to the medium term wave 3 target low of $41.90 [C]. Prior to entering the $43.50 PUT I will also make sure the Delta is between 25 to 35 to get the maximum leverage in the growth of the OTM PUT price.

    Cheers

    Friday, January 7, 2011

    "droughts, floods & a drop in profits ..."

    BHP is a key supplier in the commodities business especially for coal, coking coal, alumina & steel, and with the floods in Australia being the combined size of Germany & France, many of the mines are flooded, rail heads are under around 20 feet of water, roads are blocked and the expectation is that supply will be interrupted for well over six months before infrastructure can be rebuilt and replaced etc. 
    China & India are key customers of Australia and of BHP with respect to coking coal so the impacts are likely to have a global impact on the pricing of manufactured goods out of these countries as well.

    In addition, Queensland is where the floods are, and it is a major food growing area and exporter as well and prices are expected to increase between 30-50% due to the wide spread devastation of crops so industries involved in this space will also have significant downward pressure on their P&L as well.


    In the attached BHP price chart from today, (6th January 2011), price has broken out of the regression channel, passed below the 6,4 exponential DMA and looks to be heading south along with BHP's near term profits. Added to this, the 10,70 Elliott Oscillator which tracks institutional support, is declining and without the larger fund and corporate support, BHP's price has a higher probability of weakening.

    Today price touched the ellipse support and retraced, this could be a momentary test or an interim support point, so I am waiting for price to cut below $44.68 before entering. The trade has a good risk reward profile with an expectation of around 2.5:1 (250% ROI), by the time it hits the MOB target at $41.86. Currently the $44 PUT options have a Delta around 35 which is the sweet spot on the delta curve where options offer the cheapest purchase price and have the fastest potential gain up the Delta curve as price moves. 


    Cheers